Wow, Paul! This is great! I hope you can make it available soon and also I hope you manage to be compensated for your investment in time and great expertise.
-royjohn
Sure, the high cost is the drawback with LAICPMS, however on a sensitivity and cost per element basis it is superb and there is no substitute for fast geochemical “fingerprinting” by it. The only scientific drawback is that some elements are difficult to measure accurately because of interferences. I started off helping academics with samples for their research so was lucky. To finish my further research I have had to pay for sample prep and analysis; however there was no real alternative. Also, since zircon is used a lot for dating purposes there are quite a few analyses documented in published research papers. Fortunately, many are now open source and don’t require purchase of copies from publishers. This saves appreciably on the costs of private research
You’re absolutely right about mass spect… it is the ONLY method by which isotope ratios and TE profiles can be obtained. Zircons do have the advantage of a huge data base, as you mentioned it’s used for dating as zircon sequesters uranium. I am very interested in the results and look forward to your publishing your data and conclusions about the zircons that your are studying. Please keep me apprised to your progress.. Your contribution to the geochemical literature will add to the growing body of knowledge of the neoproterozoic. Your projects have been extremely productive. I am in awe!!!
I’m sure that you have the reference below:
Mud Tank Zircon: Long-Term Evaluation of a Reference Material for U-Pb Dating, Hf-Isotope Analysis and Trace Element Analysis
Sarah E. M. Gain](lly/Suzanne+Y. 16 April 2019
https://doi.org/10.1111/ggr.12265
My question for you about the Mud Tank zircons are as follows: did they crystallize as a late residual silica rich phase or are they xenoliths? Most references indicate crystallization from carbonatite magma, as they show zoning and are large euhedral. Second question: Is the mud tank field being developed for REE mining?
References again show potential for economic mining.
stable isotopic ratios, trace element profiles can also be gleaned from LA-ICP MS… EMP helps a lot but MS is the only way to determine age, petrogenesis. I do have a question that you might help me with. The petrogenesis of igneous hosted sapphires has been controversial. Current theory suggests that subducted peraluminous sediments undergoing high grade metamorphism is the source of corundum at depth, subsequently brought to the surface by deep seated alkaline magma… if this is the case, aluminous rocks such as feldspar would transition into garnet eclogite… how does corundum for from high grade aluminous metamorphic rocks?.. Second question is about the depth and PT conditions for garnet to transition into spinel… References would be appreciated. Thanks for your consideration.
Congrantulations! Great work! Please send me a reprint of your paper and paper in progress. Thanks and thanks for the science. StevenH.
I am preparing a paper to follow the one I wrote on the giant zircon crystals at Mud Tank, and which was published in the Mineralogical Record in late 2020. My forthcoming paper corrects and adds to some of the earlier information. Also, I think it will answer some of the petrogenetic questions you ask. In regard to REE content, the Mud Tank carbonatite is low in REE compared to most apatite-containing carbonatites. In any case commercial mining is presently forbidden on the public and cost - free Mud Tank zircon field. There should be more such reserves in the world for late - age fossicker - researchers like me!
2 Likes
Hello Paul. I admire your enthusiasm in building low cost instrumentation. I have tried optical UV - VIS spectroscopy on transparent zircon using disposals research spectrophotometers and found the obtained spectra of little research use. This is because the spectra only reveal limited information on actual composition so a detailed comparison of samples is futile. Another factor to consider when one looks at techniques such as LAICPMS is the importance of sample preparation and instrument operator experience with samples. Unfortunately, it’s not sufficient to possess the equipment: tweaking it to get the best result is often the key to success. Please don’t consider this a put down by me. I wish you success in your quest to get analysis instrumentation down in cost and I would be the first to praise you for doing that. Spectroscopy etc. aside, it occurs to me that since uranium is generally associated with copper in ores, that a scintillometer (rather than the comparatively insensitive Geiger counter) may be useful in differentiating between turquoise of different origin,
1 Like
Please give me the DOI number of your paper. That would be much appreciated. LAICPMS still is beyond the reach of jewerly stores… plus it’s minimal destructive…What Paul is doing should be congrantulated… a low cost, pretty accurate and very sensitive off the shelf piece of equipment…something affordable for home use… it would still be the first good step for ID… coupled with other readily avaiable testing, it would more than just complement traditional testing and optical microscopy.
Your point about U in Cu ore is well taken. However, I am not aware of large comparative data bases that list U from different copper mines across the world. data on orogenic copper/gold versus igneous porphyry copper deposits aren’t available, unless it’s due to my ignorance on the topic. Direct dating of copper deposits on copper minerals so far as I know is not satisfactory… leakage of Pb skews dating…Ar/Ar and K/Ar dating can be used on biotite associated with igneous intrusions… Turqouise is so variable that LAICPMS has to be used… variablity within a single sample is a another problem…in both cases, multiple pulses of mineralized fluids complicate the picture, intrinsic to the nature of copper deposits…
1 Like
REE exploration and Li resources are going on in the US everywhere there’s anything of promise. We are critically short of these stragetic metals. Recycling is cost effective now. REE resources are particularly acute… 90% of the world’s proven reserves are in China. Our President is willing to wage trade war with the rest of the world into bullying friends and foes alike, but doesn’t even know what these materials are and what we are lacking. Summary rejection of alternative energy is a typical symptom of his ignorance. In addition, he’s made it clear that he not only unwilling to be informed but is actually pround of being ignorant…His comments on windmills “killing whales” are absurd but his devoted followers, like religious fanatics will believe anything that he says, even if it’s nonsense… I’m afraid that he will order windmills be outlawed and torn down. I have invested heavily in windpower as it’s cost effective to natural gas, of which the US has more than an abundance of, and is the our cheapest fossil fuel. Sorry for the phillipic, but more than half of US citizens feel as I do. Yet he was elected…
Getting back to stragetic minerals, the only producing REE carbonatite in the US is in the California desert. Another large reserve has been found not too distant from where I live. I used to go there to collect rare mineral samples, including some turquoise, baestanite… they are is on US federal property as part of the national forest, however US law allow mining companies under a law passed in 1847 to claim public lands for mining. There is a very small, weathered outcrop of calcium carbonatite there. The independent contract exploration geologist who had been working there gave me a sample of a core drilling… the varieties of igneous rocks at the locale in cores are mind boggling ranging from sanidine trachyte to carbonatitite. every variety of mafic saturated to unsaturated igneous rock is present including rare potassic unsaturated rocks. The area was first claimed by Newmont Mining, a large multinational, for a gold reserve estimated at 20M oz… Now it’s REE that a Canadian comany is preparing to mine. A large strip mine in a once pristine area will create a pit where a mountain was… the entire area surrounding has been fenced off and is off limits to the public… the buffer zone, also claimed, extends a mile around the deposit. No zircon nor any gem material is present. Age determination was by K/Ar… mid Eocene as most of the subvolcanic intrusions are in the Black Hills of South Dakota, extending westward into central Montana…One of my friend wrote her PhD thesis, and subsequently published a series of papers on the tectonics and petrogenesis of these rocks.
A parallel belt of alkalic rock, including Kimberlites extends from Kansas through Arkansas. REE mineralization is in Arkansas, again of young age. Known carbonatites but relatively newly discovered REE reserves are in southern Illinois…and some remote parts of Wyoming. Over all, the US only has at most a handful of economic reserves.
1 Like
Hi Paul. Your work sounds very impressive. My experience, and only on zircon. is that spectra are not very helpful as regards provenance. This is because UV-VIS spectra of transparent zircon generally show broad bands and also absorption spikes as one generally gets in zircon for Uranium 4+. My impression is that turquoise is a non transparent mineral and thus surface examination may assist. Such examination can be done with an incident polarised light microscope as is used to examine polished specimens of ores to work out richness etc. I have one of those but find my petrological one for transparent specimens more useful for zircon.
1 Like
Please send me the reference… I will message you my email address. I’d love to read your old paper and look forward to reading your updated data and conclusions, Thanks, StevenH
My paper on Mud Tank zircon crystals was published in the Mineralogical Record volume 51, November - December issue 2020. My forthcoming paper (publisher not yet known) will deal with that zircon’s petrogenesis. An intriguing question, made more interesting since a 67 kilo zircon crystal was found there in 2023.
1 Like
thanks… 67 kilo zircon must be a world record. I am very interested in your up coming paper also. I also find it extraordinary that you are not a professional geologist/geochemist but a health science person… same goes for me… I love it! Thanks again.
I found the journal but didn’t find your paper in the contents. Do you have an e-reprint that you can send to me at my personal email address? If you message privately or email me your full name as author, and list any coauthors, I should be able to find your paper. Otherwise, I would have to purchase the issue. Thanks, SteveH
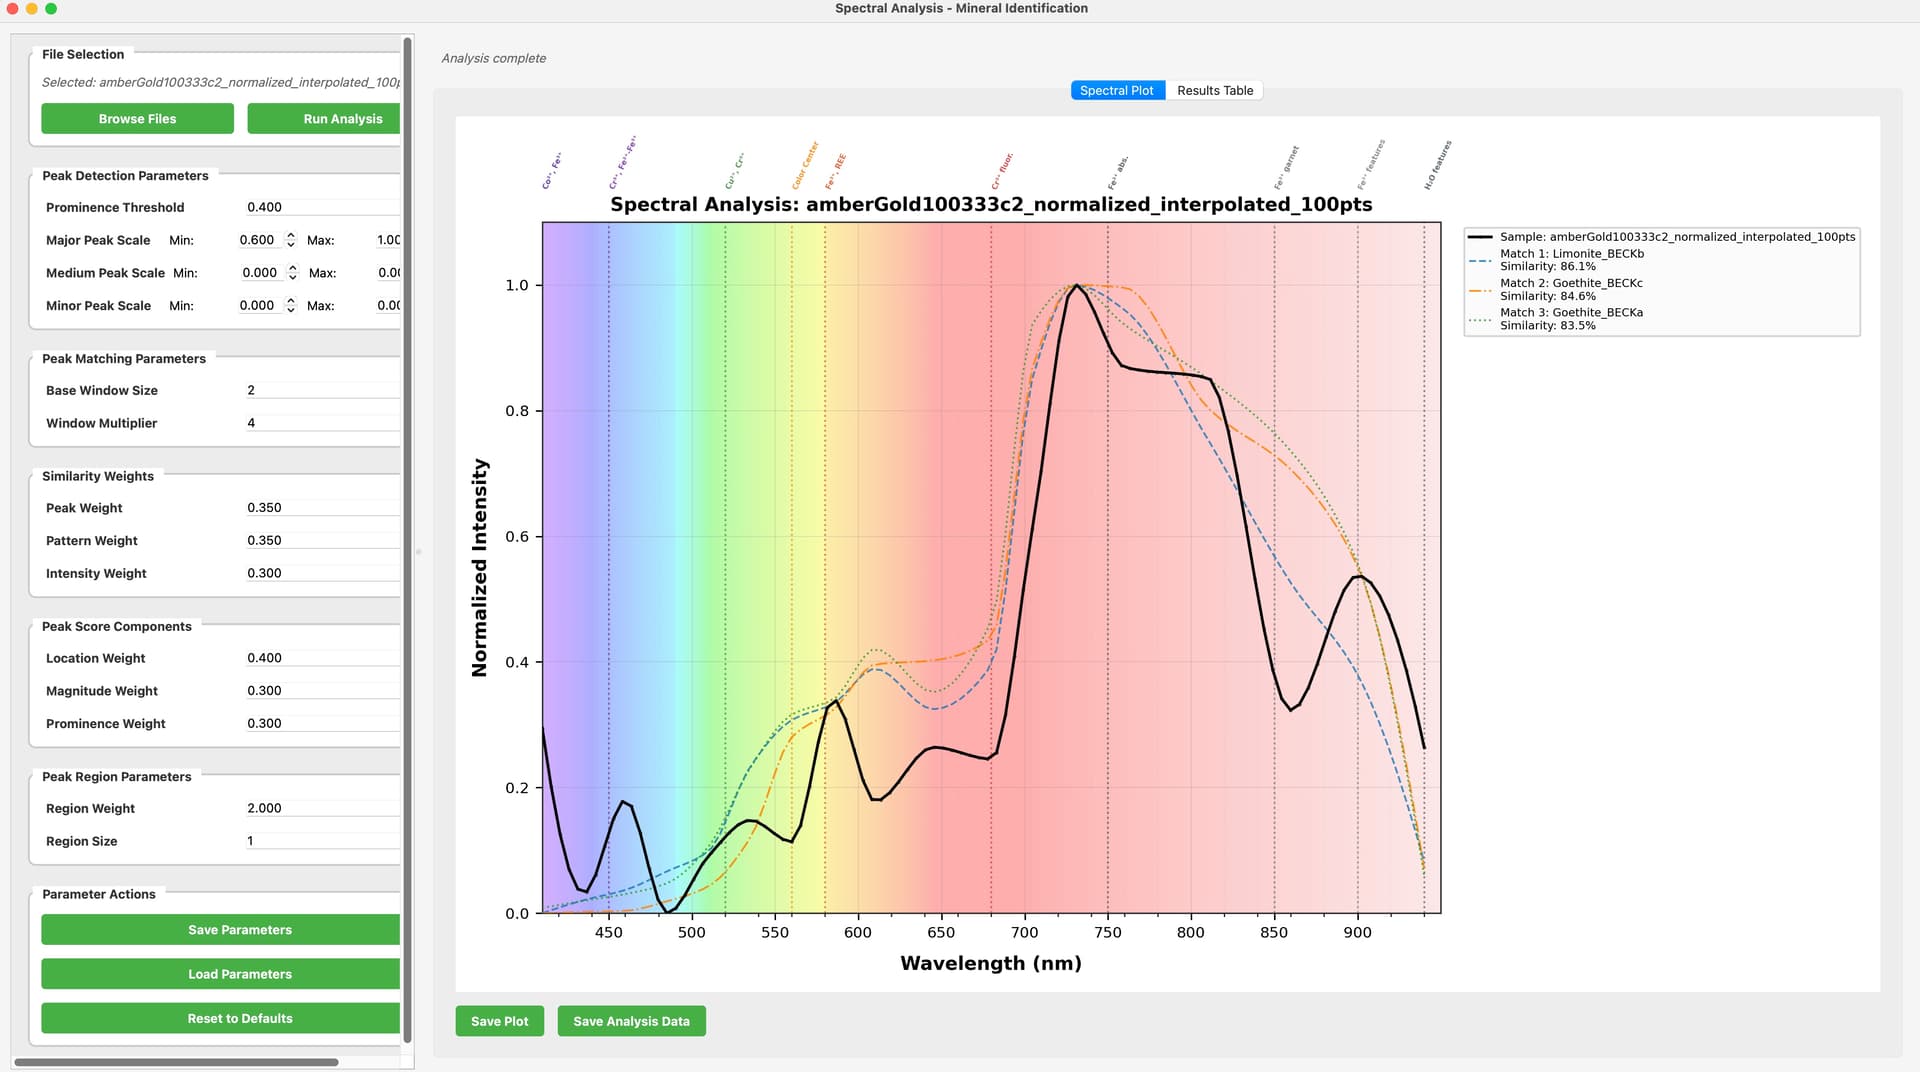
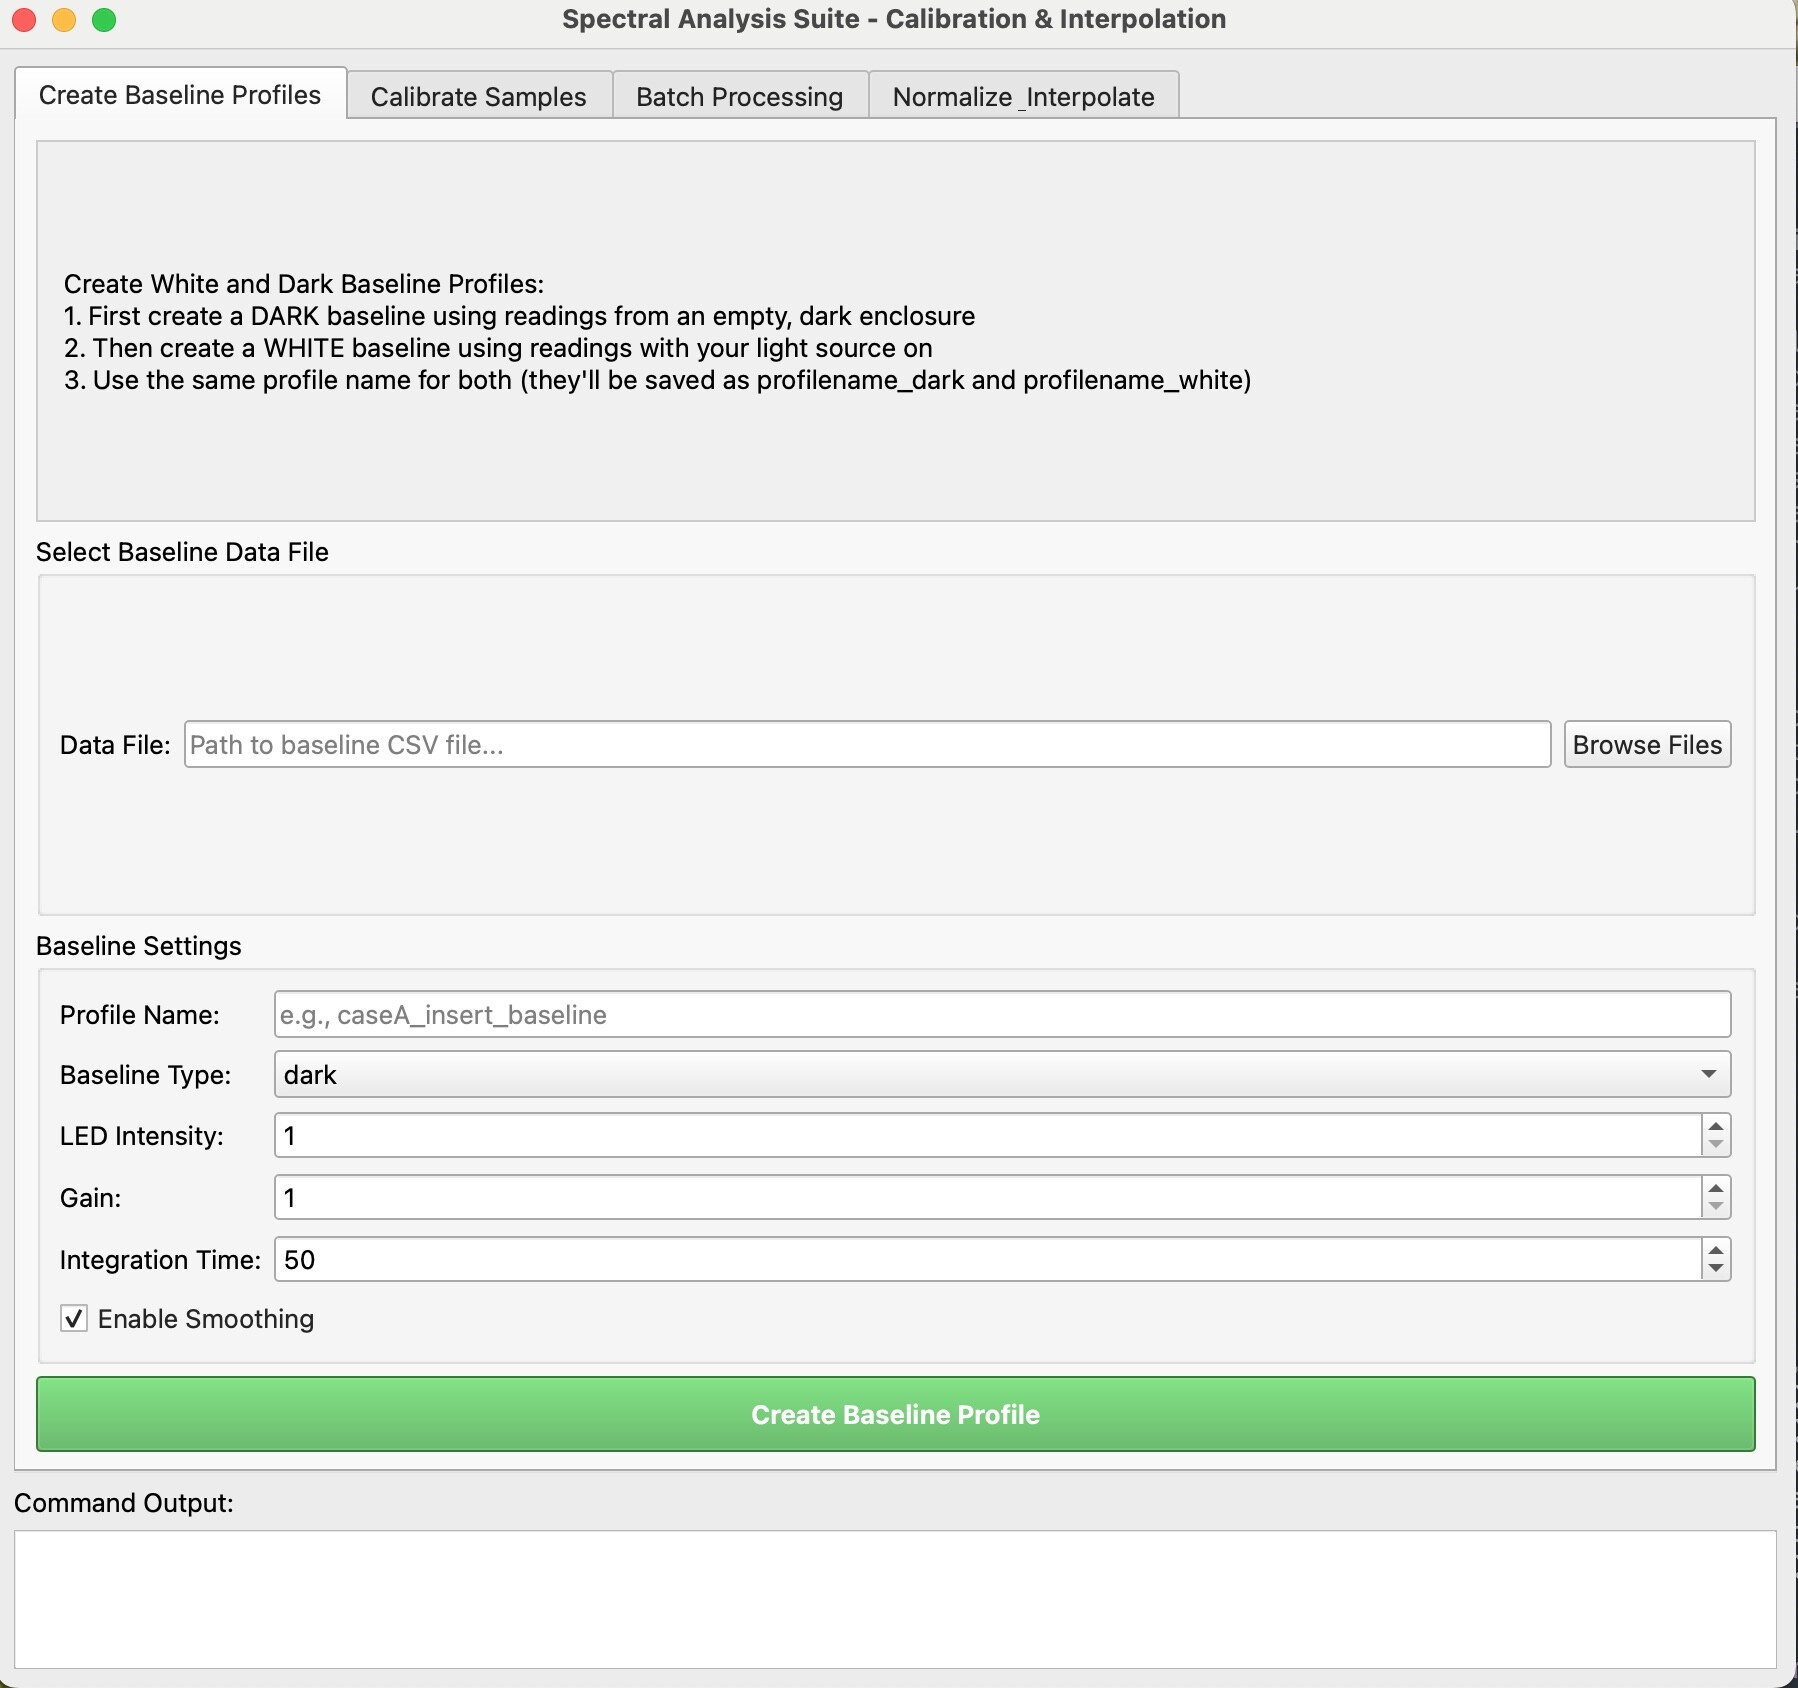
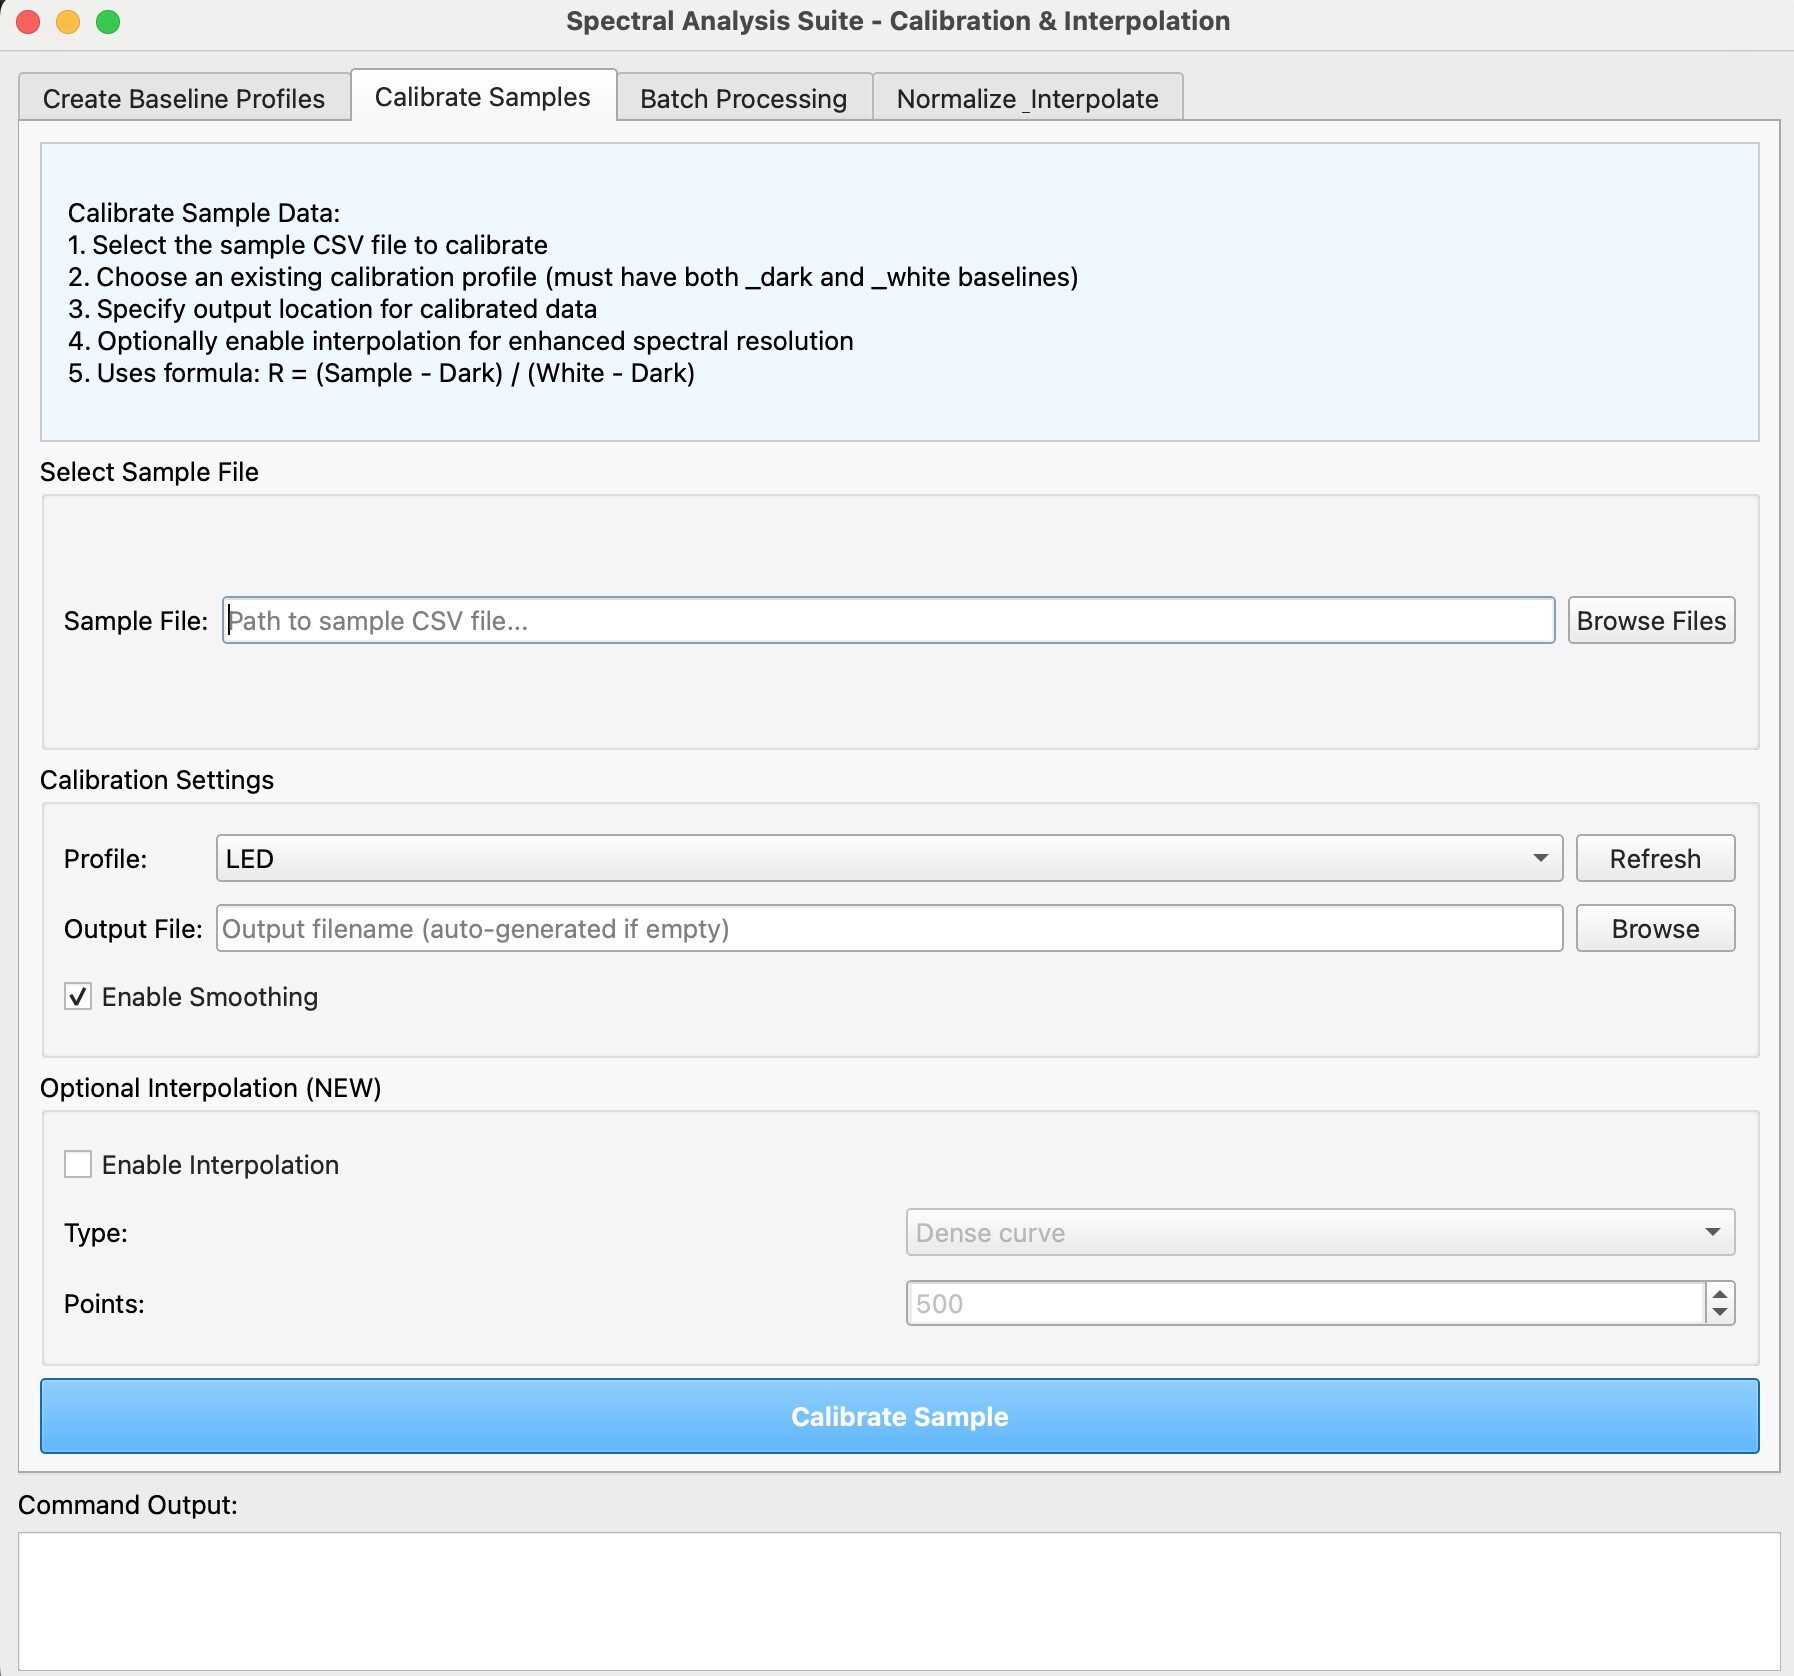
Hey all, I wanted to update on the home-brewed spectrometer project. I am pretty much done with the basics, but with the rapid proliferation of so many low-cost sensor modules, I wanted to tweak all the code so that it can be used with sensors other than the ones I was using (I’ve since changed to a CCD based unit, so I know it works for at least two popular chipsets. I sort of went to town with the idea, and I wrote the code for sampling, but also added calibration, processing and analysis/matching. The non-sampling stuff, I have come to believe, are the long poles in low-cost spectrometry, there is just a lot to the other stuff that can’t really be compromised or the sensor fidelity doesn’t really matter. When I have a moment I’ll post on GitHub, my hope is others help enhance the code, and at some point, make a windows or IOS front-end. Since so much math is involved, and since really the best platform for scientific math-related coding like this is python, my code is currently in python, BUT, I got sick of menus and the CLI so I wrote a pretty respectable GUI, I think. Attached are a few screenshots. What I have come to realize is that the open reference mineral libraries are really not standardized enough such that they can be used off-the-shelf for matching, so I took the liberty of combining a lot of that data, adding a bunch of my own, and creating a reference dataset groomed for this code. Again, my hope is that if I post it, and if I enhance the spectrometry code with a simple ‘Click here to add sample to reference dataset’, over time, this grows through community contribution. We shall see. Anyhow, let me know if anyone wants the code, I’m happy to provide. Once you get over the hump of running python on your PC or mac (Mac is WAY easier), the GUI is super simply and requires no coding. In theory, the code should also work with lab spectrometers, and I can see some merit in creating an open reference dataset for such machines that aren’t proprietary, but either way, it’s been a lot of work, but I’ve learned a ton and I am mostly happy I did it.
3 Likes
Hey Paul,
That is awesome progress. The software is one of the hardest parts to overcome but it seems you have ran the gambit with success! I like how clean the GUI looks! Nice Job!
-Troy
Thanks. The hardest part was figuring out the various methods (calibration, sampling, etc)., since the whole spectrometer business uses insanely expensive reference light sources to calibrate the white baseline. If you think about it, though, that’s simply not necessary, since for mineral spectrometry, you aren’t measuring absolute colors, but relative intensity of reflected light, so all you need is an accurate dark and white reference, and single is then, by definition, the relative variations of intensities within that range. you can get a near perfect calibration that is instrument specific (the best kind) with off the shelf reference pigments (i made my own reference white with barium sulfate, titanium dioxide and a clear matt acrylic medium - it measures as good as any reference pigment and even better sense the method is specific to my sensor enclosure). It’s been a lot of learning but I think i got the basics done quite respectably. I’ll shae’s the github link with code, schematics and .stl 3D print files when i get around to posting.
1 Like
Great work! keep at it. let all of us know when you’ve got a working model. Sounds like you’re almost there or there! Thanks for the info.